Back in November, I was working through a macro question that, at the time, felt quite academic, and via price action, arguably clearly actionable:
What happens when the U.S.–Canada yield spread reaches an extreme far outside its historical range? (I had noticed there was significant disparity)
That question led me down a path comparing 10-year U.S. Treasury yields with 10-year Government of Canada bond yields, and more importantly, looking at the percentage difference between the two rather than just the raw spread.
What stood out immediately was how stretched conditions had become.
An Unusual Yield Divergence
Historically, the U.S. 10-year yield tends to trade at a premium to Canada’s, but that premium usually oscillates around a long-run average of roughly 20%. At times it narrows, at times it widens — but it rarely stays extreme for long.
By late 2024 / early 2025, that premium had expanded to nearly 45%, a level that sat well outside the norm going back to 2022. In other words, U.S. yields were offering almost half again as much return as their Canadian counterparts on a relative basis.
That alone doesn’t guarantee anything — but in macro markets, extremes matter.
Yield differentials influence capital flows, and capital flows influence currency prices. When one country’s bonds suddenly offer an unusually large advantage, capital crowds in. But when that advantage peaks, the balance of risk begins to shift toward mean reversion.
The FX Implication
If the yield gap were to normalize — even partially — the implication would be straightforward:
- Less incentive to hold USD purely for yield
- Reduced relative demand for U.S. assets
- A stronger Canadian dollar
- A declining USD/CAD exchange rate
At the time, USD/CAD was trading near 1.40–1.41, an area that had already rejected multiple advances.
Fundamentals Meet the Chart
What made the thesis more compelling was that price action agreed.
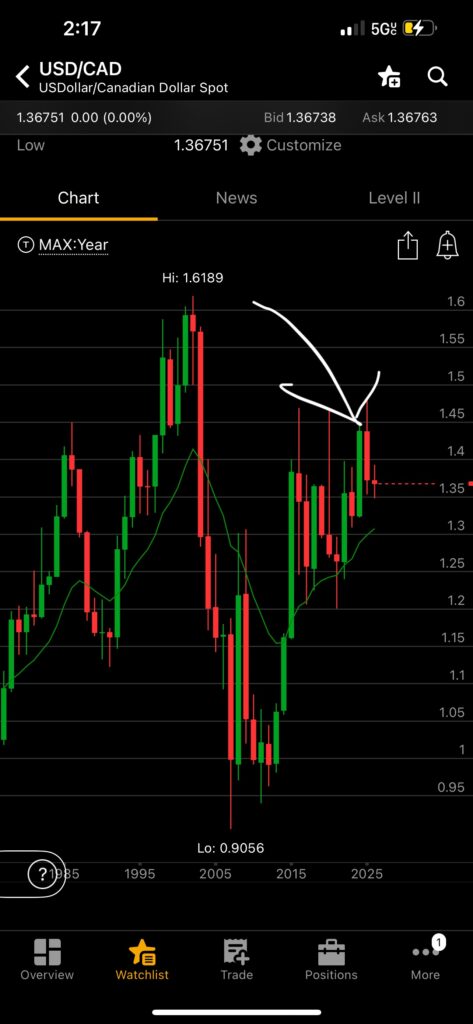
On the USD/CAD chart, the market was carving out a clear double top — a classic technical signal suggesting exhaustion rather than continuation. Technical patterns alone can fail, but when they align with fundamental stretch, they often carry more weight.
In this case:
- Fundamentals said the yield spread was historically extreme
- Technicals said USD strength was running out of momentum
- Together, they pointed toward CAD appreciation
What Happened Next
Over the next two months, that scenario played out almost textbook-style.
- The yield spread began to compress
- USD/CAD rolled over from its highs
- Spot declined from ~1.41 to the low-1.33s
- The Canadian dollar strengthened as relative conditions normalized
No move is ever perfectly linear, but the directional thesis held.
An Interesting Secondary Signal
One additional development caught my attention more recently.
As USD/CAD continued lower, 10-year yields themselves also began to drift down, reinforcing the idea that peak rate expectations were being reassessed. Then, almost immediately after I had been discussing this relationship verbally while brainstorming content ideas, the U.S. 10-year experienced a sharp one-day surge — roughly 7–8 times the average daily range of the prior two weeks.
Was it coincidence? Possibly.
Or it may have been:
- Profit-taking
- Hedging activity
- Positioning adjustments around a widely recognized macro narrative
In macro markets, reactions often occur after a theme becomes obvious, not before.
The Broader Takeaway
The real lesson here isn’t prediction — it’s process.
Markets don’t move because of one indicator. They move when:
- Relative conditions reach extremes
- Flows begin to rebalance
- Price action confirms the shift
Yield differentials don’t dictate FX in the short term, but they tilt the odds. When those odds line up with technical structure, the probability of being on the right side of the trade increases meaningfully.
Sometimes the most useful insights don’t come from forecasting the next data print — they come from noticing when the system itself has drifted too far from equilibrium.
And eventually, it tends to find its way back.
Putting This in Plain English
Before wrapping up, it’s worth stepping back and explaining this in layman’s terms, because the core idea is actually very simple once you strip away the jargon.
Below is a chart showing the percentage difference between U.S. and Canadian 10-year treasury yields over time.
What I noticed in November was this:
- Canadian 10-year treasury yields were significantly lower than U.S. 10-year yields
- But more importantly, they were much lower relative to the U.S. than they had been on average in prior years
- The gap wasn’t just “wide” — it was historically extreme
In normal conditions, U.S. yields tend to be somewhat higher than Canadian yields. That difference fluctuates, but it usually stays within a fairly stable range.
By late 2024 and early 2025, (and then when I noticed this in November of 2025) that relationship had stretched far beyond what had been typical since 2022. The U.S. was offering an unusually large yield advantage, while Canadian yields lagged well below both U.S. levels and their historical relative norm.
When markets reach that kind of extremism, two things tend to happen:
- Capital flows become crowded on one side
- The probability increases that conditions revert back toward something more normal
That doesn’t require a dramatic event — it can happen simply through:
- Slowing momentum
- Shifting expectations
- Or gradual rebalancing of capital
In this case, a move back toward a more normalized yield relationship implied:
- Less relative demand for U.S. dollars
- More support for the Canadian dollar
- A declining USD/CAD exchange rate
Which is exactly what unfolded over the following two months.
The takeaway isn’t that yields must return to a precise average — markets rarely work that cleanly — but that when relative conditions stretch too far, they tend to correct in ways that ripple through currencies, bonds, and risk assets alike.
Sometimes the edge comes not from predicting something new — but from recognizing when something has gone too far.
See the Chart:
2022–2025 overall (Jan 2022 → Dec 2025)
- Average spread: 0.676 pp
- Average percent difference vs Canada: 20.71%
- Minimum: −5.29% (Jun 2022; Canada > US)
- Maximum: 45.60% (Feb 2025; US >> Canada)
By year (monthly)
| Year | Avg spread (pp) | Avg % diff vs Canada | Min % diff | Max % diff |
|---|---|---|---|---|
| 2022 | 0.181 | 5.89% | −5.29% | 23.07% |
| 2023 | 0.596 | 17.87% | 12.34% | 24.30% |
| 2024 | 0.869 | 26.19% | 20.15% | 38.86% |
| 2025 | 1.057 | 32.90% | 22.21% | 45.60% |
(BE SURE TO SEE THESE CHART PICS BELOW):
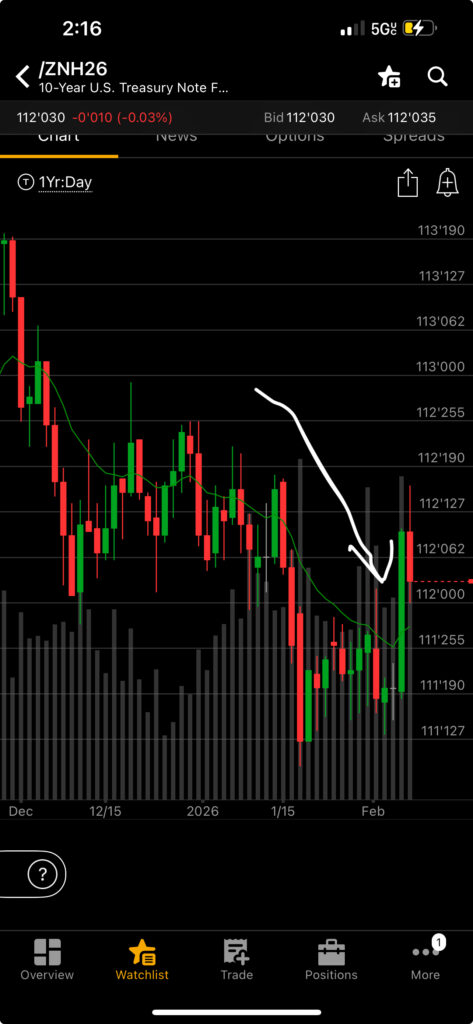
The last two months on the U.S Treasury in response:
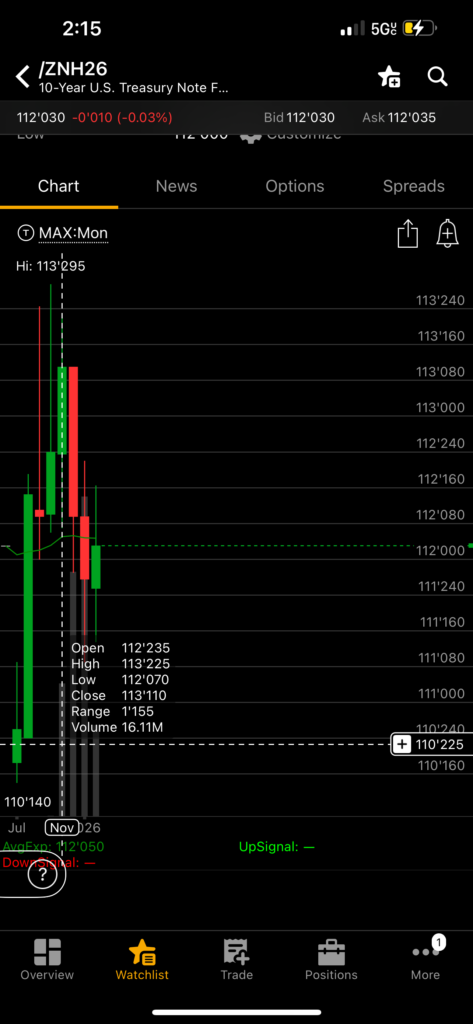
The Daily candle highlighted the day I verbally mentioned about this conclusion I had drawn last November:
The last two months of the declining USD/CAD spot since the conclusion I made (November)
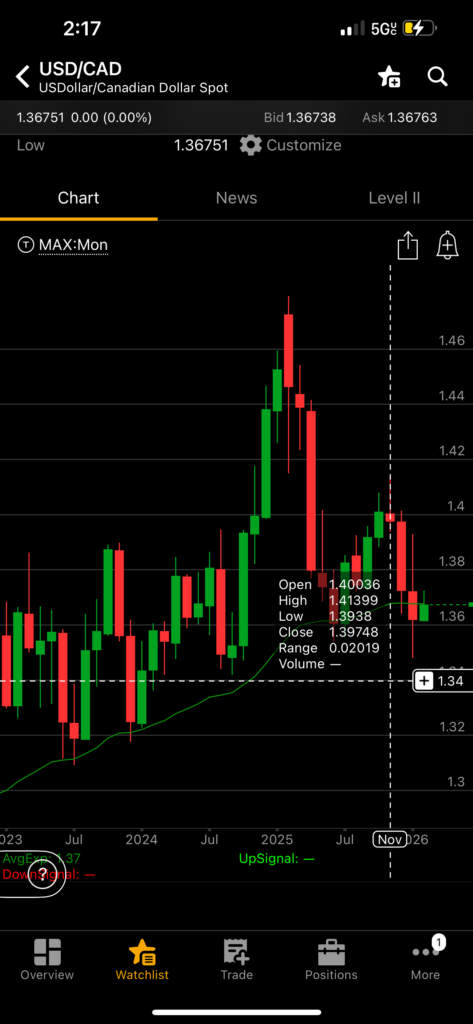
The clear double top larger technical indicator of the broad yearly market (Note that was 2025, we are now obviously in 2026):
Closing Off:
Thanks for reading and checking out this post!
If you enjoyed this breakdown or found it helpful, feel free to leave a comment — I always appreciate the discussion and different perspectives.
For more macro insights, market observations, and idea-building in real time, you can follow me here:
TheJoshWorld
- X / Twitter: @thejoshworld
- Instagram: @thejoshworld
- YouTube: TheJoshWorldMe
- Tiktok: TheJoshWorldMe
More to come — appreciate you being here.
Leave a Reply